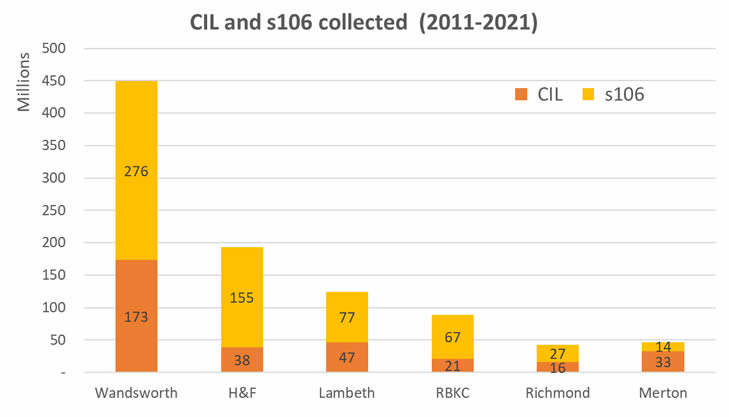
Wandsworth has collected nearly as much tax from property developments than all the surrounding boroughs together. And although the Council is using the money to cover spending otherwise paid by Council Tax, the pot is still growing with £170 millions unspent in 2021.
CJAG collected financial data from Richmond, Merton, Lambeth, the Royal Borough of Kensington and Chelsea and Hammersmith & Fulham, to compare with Wandsworth.
Developers are paying a record level of money to Wandsworth
We found that, up to 2021, the amount of Community Infrastructure Levy (CIL) received by Wandsworth (already paid, excluding monies on schemes approved but not received yet) equals £173.2 millions. The total amount collected by all the adjoining boroughs during the same period is only £154.5 millions. Wandsworth is really in another league in term of money received from developers as the other boroughs collected between £46.5m (Lambeth, with the advantage of Vauxhall developments and Waterloo) and £15.7m (Richmond being the borough with the lowest amount of CIL).
The CIL is a standard charge based on new development size and location. The money can be used to fund a wide range of infrastructure that is needed as a result of development. And indeed the diversity of project is probably much wider than you can imagine when reading the word “infrastructure”. It can cover things such as shopping parade, schools, new public realm and play features, public libraries employment facilities, tree planting, parks, carparking upgrade, CCTV cameras, air pollution, transport, primary care/health, electric vehicle charging point, signage, etc.
The CIL was created by the government in England and Wales in April 2010. Although some Councils (including Southwark) were quick to draft documentation and charging schedule, it was only in 2012 that it came into force in one area, implemented by the London Borough of Redbridge. Wandsworth was really quick to follow and applied a levy from November 2012. In comparison, Lambeth, Richmond and Merton started to charge during the financial year 2014/15 and H&F and RBKC only in 2015/16.
It came in addition to Section 106, which are agreements with developers for the provision of site-specific mitigation measures (for example, affordable housing, sustainability measures, local training and jobs). In a nutshell, all measures to make a development acceptable in planning terms. S106 is also the main mechanism for securing affordable housing when developers refuse to provide the required level of affordable accommodation within their scheme, and funding non-infrastructure revenue projects, such as carbon offset funding, employment and skills training, and local labour in construction.
Here again, Wandsworth is getting much more than the adjoining boroughs. The total collected during the period 2013-2021 is £276m, to compare with £155m in H&F and only £14m in Merton.
Wandsworth compensates the lack of Council tax income with grants from developers

When looking at nearly half a billion coming from the wave of property developments in Wandsworth (and not only Nine Elms, but also Putney or York Road for instance) and comparing with the £170m unspent, we can also say that Wandsworth is spending much more than any other borough in our study.
A local authority has several levies to fund their spending. One of them is the Council Tax of course, but you have also the business rates, the government payments and the money paid by property developers.
In a borough like Lambeth, that Wandsworth likes to compare with (they have a similar population of ~320k inhabitants in Lambeth and ~330k in Wandsworth), the Council tax (2019/20) received was £123m with an additional £20m paid by property developers. In comparison, Wandsworth received less than half that Council tax income (£61m) but more than £55m from property developers.
When you compare over the last 8 years, Wandsworth received a staggering amount of nearly £450m from property developers (£56m/year in average) in comparison to only £77m for Lambeth (£9.6m/year in average). And when you add, over the period, the Council tax collected with payments from property developers, you see that the final amount is actually nearly identical for both boroughs to about £900m.
Is Wandsworth council addicted to property developers’ money? Based on our study, the result is yes. The money coming for approved schemes in Lambeth is less than 10% of the Council tax collected over the 8 year period, while it represents more than 100% in Wandsworth.
As we said earlier, the money provided by property developers can be used for a large number of purposes: In 2020, Wandsworth’s spending was hugely impacted by several school projects including Putney Ark Academy (£13.6m), Ronal Ross school ((£2.6m), Gwynneth Day Centre (£2.5m), other primary places (£2.1m). To put in perspective, imagine that Richmond was providing money for a single project over the year, as they were using only CIL money collected.
It can also be used to compensate the lack of affordable housing (when developers are released from their obligation to provide a 33-50% of affordable units in their proposals), but also be spent on transport, road improvement, tree planting, care/health facilities…
When comes election time, you can just remember that the proud performance displayed on some leaflets comes not because of good management, but primarily because of those towers on the river side, the massive blocks erected in this low rise neighbourhood, this skyscraper planned in the former playground for your kids…etc.
For more information see:
- Property developers are cash cows for Wandsworth: a specific analysis on Wandsworth, with the contribution of Nine Elms (not even half despite all the constructions) and the split by area in the borough.
- Wandsworth’s cash machine: a comparison made in 2019, but without the data collected with the FOI
Methodology
We have compiled all figures in this spreadsheet.
In order to get the necessary data for our study, we submitted a Freedom Of Information request on 4 August 2021. Our request was simple:
For each year (annual report) between 2005 (2005/2006)* and 2020 (2019/2020) I would like to
know:
-Total CIL receipts (actually paid, not committed) in the reported year only
-Total CIL expenditure (actually spent, not committed) in the reported year only
-Total CIL balance carried forward in the reported year
-Total s106 received in the reported year only
-Total s106 expenditure in the reported year only
-Total s106 balance carried forward in the reported year
A simple spreadsheet with the figures for each financial year would be perfect (col=dates,
rows=CIL/s016 categories).
* I know there is no CIL before 2012 or at the later date that you implemented.
We have been amazed by the poor response that we received, the lack of consideration, mistakes (when comparing with already published data, some don’t match!) and we can only imagine that Councillors are not really in a position to scrutinize properly the officer’s work.
First of all, the borough of Richmond never answered the FOI.
Merton Council was the first to respond with data on August 10th (with one of the most complete response actually!).
Then came Lambeth on August 25th. They provided solely links to reports published on their website, with some only available until 2018/19 and not even bothering giving the data for recent years.
Hammersmith & Fulham Council responded on September 1st, with only the CIL data, providing no information on the section 106 funds, which was specifically requested and very difficult to find in their reports.
The Royal Borough Kensington and Chelsea responded on September 2nd, and provided some part of the information requested in a simple spreadsheet. However, not only they did not understand what was requested as they only responded with the difference between the income for a year and the expenditure that same year, their figure provided for 2014/15 contradict the AMR and IFS for those years and they could not provide any data previous to 2014!
Wandsworth Council were the last ones to respond (if we except Richmond, as we are still waiting…) but did not really answer the request. They provided only a few amounts for s106, without even saying if it refers to a balance or the annual income. They couldn’t (or did not want to) provide information prior to 2010 either.
Richmond (UPDATE 1/04/2022): Richmond only responded to our FOI on 1st March 2022, i.e. 7 months after our request and following a second email sent at the end of January). They started their email with: “I refer to your request for information received on 04/08/2021. We apologise for the extended delay with responding to your request. ” They provided a table with data from Financial Year 2012/13 onwards for the S106 queries, and referred to their financial statement for CIL (which we used previously in this article). Therefore, we have now updated the data, changing the graph #1 (CIL and S106 collected) to show 27 millions for s106 monies – our previous number was slightly overstated displaying 39 millions.
With hours spent on financial reports for the 6 local authorities, we were able to complete some additional figures with the ones provided in their AMR reports. Due to the lack of data from some Councils prior to 2013 (see RBKC and Wandsworth!), we decided to restrain the whole study to the period 2013-2021. We compiled the few figures provided by the FOI with the ones found in existing reports. When we found data in Annual Planning Authority Monitoring Reports or in Infrastructure Funding Statements we chose to use it. In some occasion, when the information was not available, we decided to calculate based on previous or future data.
You will note that not only FOI responses were sometime inconsistent with data that we could find in reports, but it was not rare that figures for past years are revised from one report to the next one (a reported figure of £1.93m becomes £1.99m in the next year report for the same period).
Most of the reports have got mistakes (for example you can read that the CIL spent in Merton in 2017/18 is exactly the same as the one spent the following year in 2018/19, up to the same penny!).
Comparisons are also made difficult as some figures include the total CIL retained, some other borough only publish the CIL minus the money allocated to neighbourhood projects. In their Annual Infrastructure Funding Statement Lambeth has no problem reporting in the same table the amount of CIL collected with the number of affordable units provided or with the number of pupils at school.
In a nutshell, an appalling jobs from most of the officers.
UPDATE 01/04/2022: Paragraph on Richmond added in Methodology and graph #1 updated


